2010 Drosophila Image Award
Winner – Video
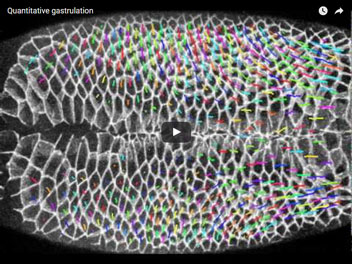
Quantitative gastrulation
We have applied quantitative methods to live imaging to understand the mechanisms behind tissue reshaping, using Drosophila embryos as a model (1,2).Live Drosophila embryo filmed during gastrulation, with the apical cell membranes labelled with Green Fluorescent protein and automatically tracked through time. On this movie frame, the multicoloured tracks represent the trajectory of the centre of each cell over the previous 4 minutes.
Butler LC, Blanchard GB, Kabla AJ, Lawrence NJ, Welchman DP, Mahadevan L, Adams RJ, Sanson B. (2009)
Cell shape changes indicate a role for extrinsic tensile forces in Drosophila germ-band extension.
Nature Cell Biology, 11: 859-64.
Blanchard GB, Kabla AJ, Schultz NL, Butler LC, Sanson B, Gorfinkiel N, Mahadevan L, Adams RJ. (2009)
Tissue tectonics: morphogenetic strain rates, cell shape change and intercalation.
Nature Methods, 6:458-64.
Runner-Up
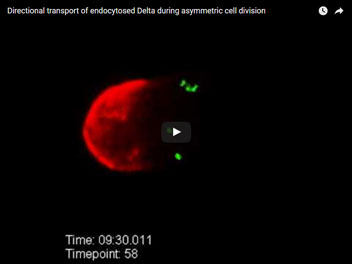
Directional transport of endocytosed Delta during asymmetric cell division
Spinning disc confocal movie depicting the intracellular transport of endogenous Delta molecules during the asymmetric division of a Drosophila sensory organ precursor cell. The Notch-ligand Delta (green) is detected using a fluorescently labelled antibody that is internalized together with the ligand from the cell surface into endocytic vesicles. This novel approach allows imaging the endosomal transport of endogenous signalling molecules in vivo. In this movie, Pon-RFP (red) accumulates first at the anterior cortex of the sensory precursor cell before being inherited by the anterior pIIb daughter cell. In contrast, endosomes transport internalized Delta ligands into the posterior pIIa cell.
Coumailleau F.*, Fürthauer M.*#, Knoblich J.A. & Gonzalez-Gaitan M.# Directional Delta and Notch trafficking in Sara endosomes during asymmetric cell division. (2009)
Nature /458/, 1051-1055.
Runner-Up
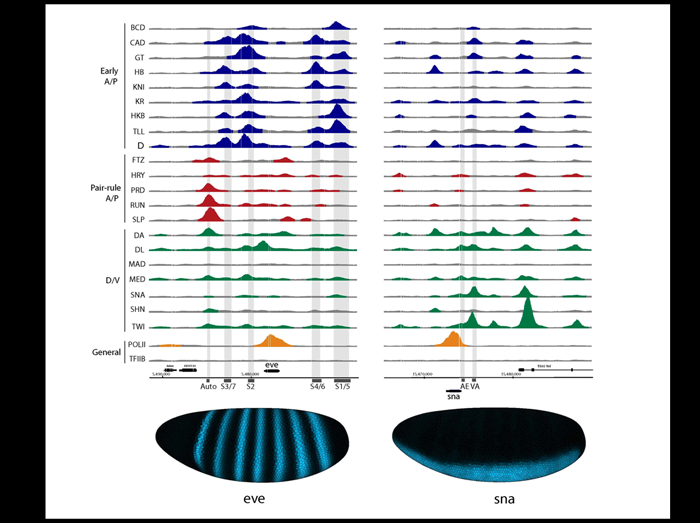
Quantitative differences in transcription factor DNA occupancy determine very different output expression patterns
We have mapped the in vivo DNA binding of 21 transcription factors that specify embryo pattern formation in the blastoderm using ChIP-chip. Surprisingly, these factors bind to thousands of overlapping sites throughout the genome. Detailed analyses show that the regulatory outcome for each enhancer, each bound by many factors, is determined by the relative levels of binding by these factors.
The figure presented here illustrates the complexity of the combinatorial control of gene expression, and the importance of interpreting the contribution of each factor to the regulatory function at each enhancer quantitatively. It shows that the known blastoderm enhancers of the eve and sna genes are each bound extensively by factors that belong to each of the major regulatory classes. Yet the output expression patterns of these two target genes differ dramatically. Closer inspection reveals that the early stripe enhancers of the eve gene are bound more strongly by the A/P maternal, gap, and terminal factors; the eve autoregulatory enhancer is bound more strongly by A/P pair-rule factors; and the sna enhancers are bound more strongly by D/V factors. The enhancers bound most strongly by members of a regulatory class correspond to those initially identified as likely targets of these proteins in molecular genetic experiments. In addition to these primary regulatory effects, however, some of the lower levels of binding may also contribute to transcriptional regulation, though more weakly. Thus, for eve the binding by D/V factors may explain the small but significant differences in expression along the D/V axes for each stripe, while for sna, beside its dominant D/V expression pattern, the binding of A/P factors may cause the quantitative variation in expression along the A/P axis.
MacArthur, S. Li, X.Y., Li, J., Brown, J.B., Chu, H.C., Zeng, L., Grondona, B.P., Hechmer, A., Simirenko, L., Keränen, S.V.E., Knowles, D.W., Stapleton, M., Bickel, P., Biggin, M.D. and Eisen, M.B. (2009)
Developmental roles of 21 Drosophila transcription factors are determined by quantitative differences in binding to an overlapping set of thousands of genomic regions.
Genome Biology 10, R80.
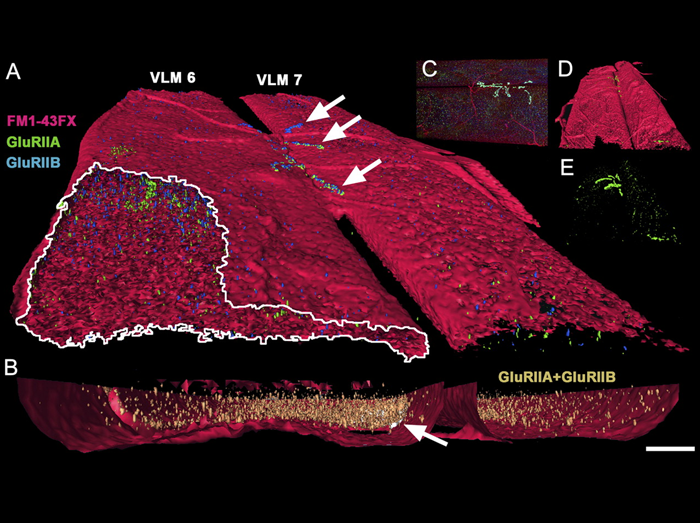
Glutamate receptors in the larval neuromuscular junction (NMJ, indicated by arrows) are assembled from protein subunits, but if there is an improper proportion of different subunit protein types, then excess subunit proteins accumulate intracellularly, as shown in this confocal reconstruction of larval ventral longitudinal muscles visualized with the plasma membrane dye FM1-43 (red) and antibodies against the essential subunit proteins GluRIIA and GluRIIB (green, blue, or gold). In this case, the improper proportion of subunit proteins resulted from the absence of microRNA-mediated suppression of glutamate receptor transcripts. This was the first demonstration in any organism of microRNA-mediated regulation of glutamate receptor synthesis, and showed that specific microRNAs control the proportion of glutamate receptor subunits that are produced.
Julie Karr, Vasia Vagin, Kaiyun Chen, Subhashree Ganesan, Oxana Olenkina, Vladimir Gvozdev, and David E. Featherstone. (2009)
Regulation of glutamate receptor subunit availability by microRNAs.
Journal of Cell Biology 185(4): 685-697
bicoid mRNA gradient makes protein gradient: the end of an old dogma.
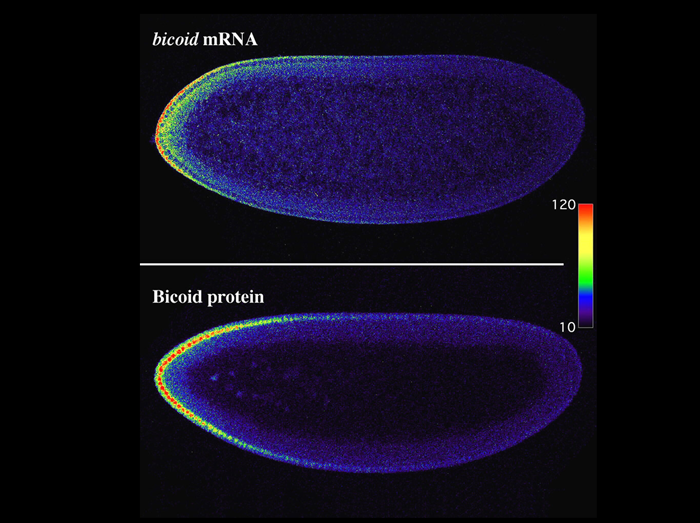
The concentration gradient formed by Bicoid (Bcd), a transcription factor that patterns anterior development in Drosophila, declines exponentially with distance from the anterior pole of the syncytial embryo, and serves as a standard paradigm for how a morphogen provides positional information. Spirov et al. (2009) challenged a prevailing model for the establishment of this gradient. Known as the SDD model, it proposed that the gradient arises when Bcd is synthesised from a bcd mRNA source localised at the anterior pole, diffuses away and is uniformly degraded. Spirov et al. refuted the SDD model: instead of bcd mRNA being localised anteriorly, a bcd mRNA gradient is formed, in agreement with a publication predating the SDD model (Frigerio et al., 1986). Thus, the mRNA gradient is the source for the protein gradient, and not diffusion of the protein.
The two confocal images show embryos at the midsagittal plane of section at interphase of nuclear cycle 14. A color intensity scale is included, with red corresponding to the highest concentrations of mRNA or protein.
Spirov, A., Fahmy, K. Schneider, M., Frei, E., Noll, M. and Baumgartner, S. (2009). Formation of the bicoid morphogen gradient : an mRNA gradient dictates the protein gradient. Development 136, 605-614.
Lipshitz, H. D. (2009). Follow the mRNA: a new model for Bicoid gradient formation. Nat. Rev. Mol. Cell Biol. 8, 509-512.
The fly nephrocyte is a podocyte-like cell with a filtration slit diaphragm
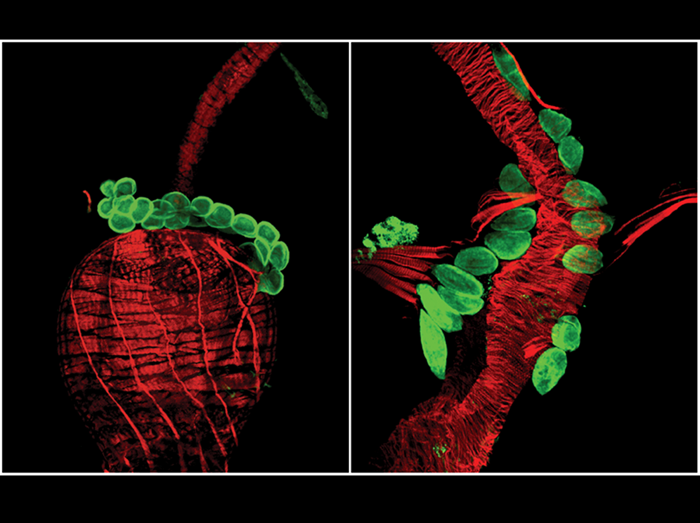
Invertebrate nephrocytes are excretory cells that regulate haemolymph composition by filtration, followed by endocytosis and processing to sequester and/or secondary metabolise toxic materials. In Drosophila there are two types of nephrocyte, garland and pericardial nephrocytes. The garland nephrocytes (left panel, green) form a necklace of cells surrounding the osoephagus just anterior to the proventriculus (both in red), whereas the pericardial nephrocytes (right panel, green) form two rows flanking the heart (red, alary muscles also appear red). We have shown that fly nephrocytes bear remarkable similarity to the glomerular podocyte, a cell in the vertebrate kidney that forms a size-selective barrier as blood is filtered to make urine. In particular both cells have a specialized filtration diaphragm that is built around a conserved molecular complex. An example of this is shown in the image. Sticks and stones (green) is an immunoglobulin-superfamily protein expressed in nephrocytes which, like its orthologue nephrin in the podocyte, is a major constituent of the diaphragm itself. These unexpected similarities suggests that the cells may be evolutionarily related and establish the nephrocyte as a simple model to study podocyte biology and podocyte-associated diseases.
Both images show third instar larvae and are counterstained for actin (phallodin, red). Anterior is upwards.
Weavers H, Prieto-Sánchez S, Grawe F, Garcia-López A, Artero R, Wilsch-Bräuninger M, Ruiz-Gómez M, Skaer H, Denholm B.
The insect nephrocyte is a podocyte-like cell with a filtration slit diaphragm.
Nature 2009 15;457:322-6
Denholm B, Skaer H. Bringing together components of the fly renal system.
Curr Opin Genet Dev. 2009 19(5):526-3
Synchronous and Stochastic Patterns of Gene Activation
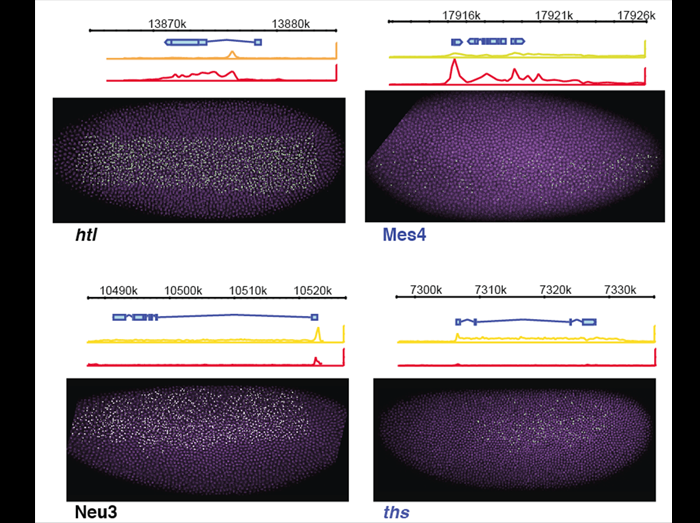
Left, both htl and Neu3 show synchronous patterns of gene activation, with all nuclei in the expression region starting production of nascent transcripts at approximately the same time. Pol II binds the promoter region of both these genes in tissues where the gene is off (orange traces) as well as tissues where the gene is expressed (red traces).
Shown right, Mes2 and ths both show stochastic patterns of activation, with some cells starting transcription well ahead of their neighbors. Pol II only loads on to these promoters in tissues where the gene is expressed.
Boettiger AN, Levine M. (2009) Transcriptional synchrony in the early Drosophila embryo. Science. 325:471-3.
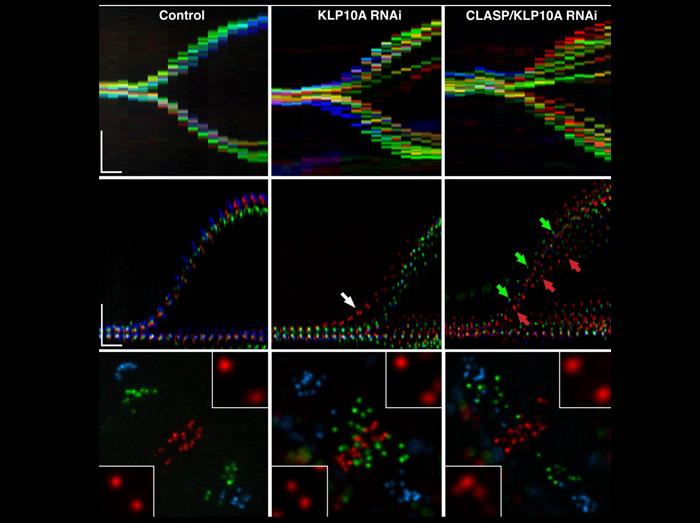
Analysis of chromosome segregation during anaphase in Drosophila S2 cells
Chromo-kymograph analysis of kinetochores in control, KLP10A RNAi, and CLASP/KLP10A RNAi cells at the metaphase–anaphase transition. Overlay of guided kymographs showing three kinetochore pairs color coded red/green/blue. Arrows indicate precocious entry of anaphase (white) or differential poleward migration (green/red). Respective projections of three different time frames. Red/green/blue frames correspond to 1, 3.5, and 7 min after anaphase onset. Insets highlight the kinetochore pairs where interkinetochore distances were maximum and minimum. Bars: (space) 5 µm; (time) 1 min; (inset) 1 µm.
Matos I, Pereira AJ, Lince-Faria M, Cameron LA, Salmon ED, Maiato
Synchronizing chromosome segregation by flux-dependent force equalization at kinetochores H. J Cell Biol. 2009 Jul 13;186(1):11-26. Epub 2009 Jul 6.
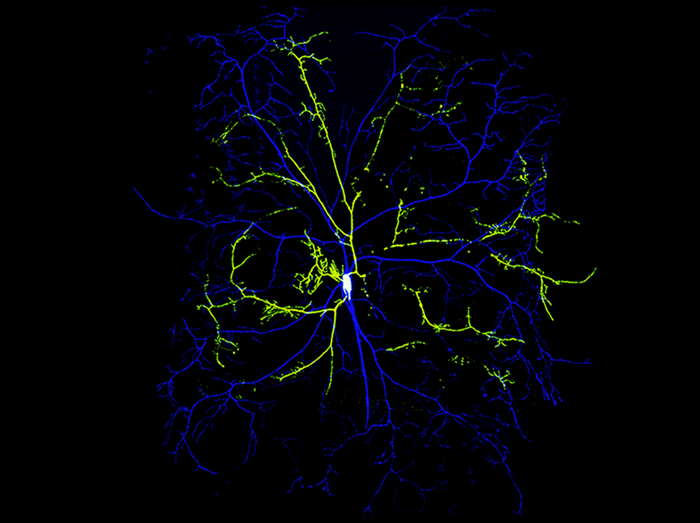
Dysfunction of mitochondrial gene, prel, causes simplification, downsizing and local breakage of dendritic arbors
Dendritic arbors of Drosophila class IV ddaC sensory neurons of the wild type (Blue) and prel loss-of-function mutant (Green). In contrast to the complicated and expansive arbor of the wild-type neuron, that of the prel mutant neuron was simplified and major branches were broken. Dendrite image of prel mutant neuron was overlaid with that of WT.
Tsubouchi A, Tsuyama T, Fujioka M, Kohda H, Okamoto-Furuta K, Aigaki T, Uemura T.
Mitochondrial protein Preli-like is required for development of dendritic arbors and prevents their regression in the Drosophila sensory nervous system.
Development. 136(22):3757-66 (2009).
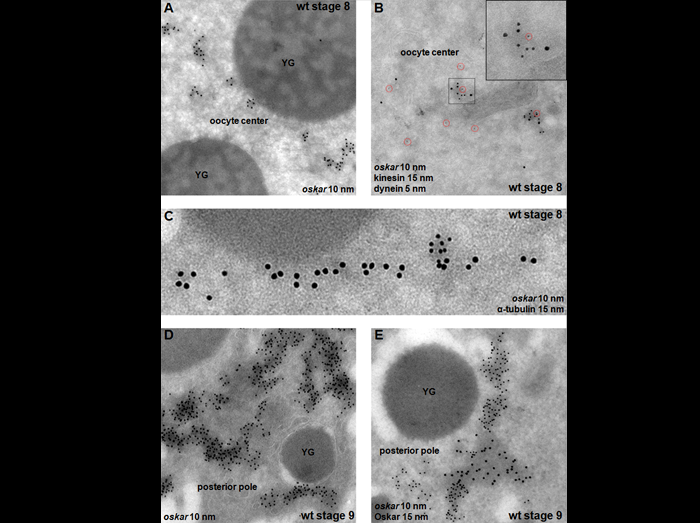
High-resolution analysis of oskar mRNA transport in the Drosophila oocyte
(A-C) oskar mRNA detection on ultra-thin cryosections of wild-type stage 8 oocyte processed for in situ hybridization coupled with immunoelectron microscopy. (A) oskar mRNA is observed within non-membrane bound particles that are enriched in the center of the oocyte. (B) Triple labelling for oskar mRNA (10 nm gold), kinesin (15 nm gold) and dynein (5 nm gold, red circles) reveals that both motors associate with oskar mRNA particles. (C) The majority of oskar transport particles are associated with microtubules. At stage 9 (D, E), oskar mRNA accumulates within large electron-dense aggregates at the posterior pole of the oocyte. Interestingly, oskar mRNA (10 nm gold) and Oskar protein (15 nm gold) are detected on adjacent but distinct cellular structures (E). YG (Yolk Granule).
Trucco A., Gaspar I., Ephrussi A. 2009.
Assembly of endogenous oskar mRNA particles for motor-dependent transport in the Drosophila oocyte.
Cell. Nov 25;139(5):983-98.
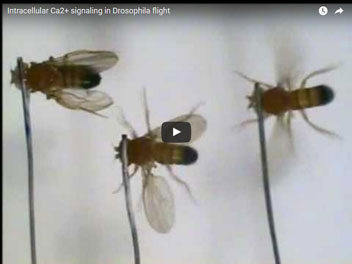
Intracellular Ca2+ signaling in Drosophila flight
Flight ability of inositol 1, 4, 5 trisphosphate receptor mutant flies is restored by introducing additional mutations in SERCA and Orai. Air puff delivery to a wild type Drosophila elicits sustained flight with rhythmic wing beating. Flies mutant for inositol 1, 4, 5 trisphosphate receptor (itpr) are flightless and exhibit brief non-rhythmic wing flapping. The flight ability of mutant flies is restored by introducing additional mutations in SERCA (kum) and the store operated Ca2+ channel encoding gene Orai simultaneously. Real time video recording of air-puff induced flight in flies of the i) itpr mutant, ii) double mutants of itpr and kum and iii) triple mutants of itpr, Kum and orai (left to right). Following a gentle air-puff, itpr mutant flies (left) are unable to initiate wing beating, flies mutant for itpr and kum (middle) exhibit brief periods of wing beating, while flies mutant for itpr, kum and orai (right) exhibit sustained flight patterns. Venkiteswaran, G. & Hasan, G. Intracellular Ca2+ signaling and store-operated Ca2+ entry are required in Drosophila neurons for flight. Proc Natl Acad Sci U S A 106, 10326-10331 (2009).Flight ability of inositol 1, 4, 5 trisphosphate receptor mutant flies is restored by introducing additional mutations in SERCA and Orai. Air puff delivery to a wild type Drosophila elicits sustained flight with rhythmic wing beating. Flies mutant for inositol 1, 4, 5 trisphosphate receptor (itpr) are flightless and exhibit brief non-rhythmic wing flapping. The flight ability of mutant flies is restored by introducing additional mutations in SERCA (kum) and the store operated Ca2+ channel encoding gene Orai simultaneously. Real time video recording of air-puff induced flight in flies of the i) itpr mutant, ii) double mutants of itpr and kum and iii) triple mutants of itpr, Kum and orai (left to right). Following a gentle air-puff, itpr mutant flies (left) are unable to initiate wing beating, flies mutant for itpr and kum (middle) exhibit brief periods of wing beating, while flies mutant for itpr, kum and orai (right) exhibit sustained flight patterns.
Venkiteswaran, G. & Hasan, G.
Intracellular Ca2+ signaling and store-operated Ca2+ entry are required in Drosophila neurons for flight.
Proc Natl Acad Sci U S A 106, 10326-10331 (2009).
